پەڕگە:Graph of example function.svg
بۆ ڕێدۆزی بازبدە
بۆ گەڕان بازبدە

Size of this PNG preview of this SVG file: ٦٠٠ لە ٦٠٠ پیکسەڵ. ڕێزەلووشنەکانی تر: ٢٤٠ لە ٢٤٠ پیکسەڵ | ٤٨٠ لە ٤٨٠ پیکسەڵ | ٧٦٨ لە ٧٦٨ پیکسەڵ | ١٬٠٢٤ لە ١٬٠٢٤ پیکسەڵ | ٢٬٠٤٨ لە ٢٬٠٤٨ پیکسەڵ.
پەڕگەی سەرەکی (پەڕگەی SVG، بە ناو ٦٠٠ × ٦٠٠ پیکسەڵ، قەبارەی پەڕگە: ١٨ کیلۆبایت)
کورتە
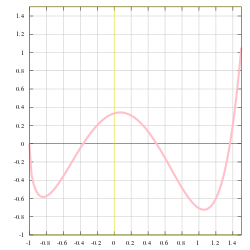
| وەسف | Graph of for the range |
| ڕێکەوت | |
| سەرچاوە | Produced by GNUPLOT 4.2 patchlevel 0 ; then curve replaced by custom smooth fit |
| بەرھەمھێنەر | KSmrq |
| وەشانەکانی تر |
|

![{\displaystyle x\in \left[-1,1.5\right]}](https://wikimedia.org/api/rest_v1/media/math/render/svg/eb217c4b770cdb51b4aaf04a1217e53583041904)

Gnuplot
# Author: Ika, 2013-07-25

set term svg size 600,600 enhanced font 'Times, 12'
set output 'func.svg'

set multiplot

set xrange [-1:1.5]
set yrange [-1:1.5]
set xtics 0.2
set ytics 0.2
set xzeroaxis lt -1 lc rgb "blue" lw 1
set yzeroaxis lt -1 lc rgb "yellow" lw 1

unset label

# Draw the exponential function
set key off

set linestyle 1 lt 2 lc rgb "gray" lw 12
set grid back ls 1.5

plot (4*(x**3)-6*x*x+1)*sqrt(x+1)/(3-x) lc rgb "red" lw 5

unset multiplot
set term x11
set output
مۆڵەتنامە
من، ھەڵگری مافی لەبەرگرتنەوەی ئەم بەرھەمە، لەژێر ئەم مۆڵەتنامەیانەدا بڵاوی دەکەمەوە:

|
ڕێگەدراوە بە لەبەرگرتنەوە، دابەشکردن ھەروەھا/یان سازاندنی ئەم بەڵگەنامەیە لەژێر مەرجی مۆڵەتی GNU بۆ بەڵگەنامەی ئازاد، وەشانی ١.٢ یان ھەر وەشانێکی تری دواتر کە بڵاوکراوەتەوە لەلایەن دامەزراوەی بەرنامەی ئازاد، بەبێ ھیچ بەشێکی جیاواز، بەبێ نووسین لەسەر بەرگی پێشەوە و دواوەی. وێنەیەک لەمۆڵەتەکە لە بەشێکدا ھەیە کە ناوی مۆڵەتی GNU بۆ بەڵگەنامەی ئازادە. |
| ئەم پەڕگەیە لە ژێر مۆڵەتنامەی | ||
| ||
| This licensing tag was added to this file as part of the GFDL licensing update. |
This file is licensed under the Creative Commons Attribution 2.5 Generic license.
- تۆ ئازادی:
- بۆ بڵاکردنەوە – بۆ کۆپی کردن، دابەشکردن و دەستبەدەست ناردنی
- بۆ تێکەڵکردنەوە – بۆ سازاندنی کارەکە
- بەم مەرجانەی خوارەوە:
- دانەپاڵ – پێویستە باوەڕی گونجاو بدەیت، بەستەرێک بۆ مۆڵەتەکە دابین بکەیت و ئاماژە بەوە بکەیت کە ئایا گۆڕانکاری کراوە یان نا. دەتوانیت بە هەر شێوەیەکی گونجاو ئەوە بکەیت، بەڵام بە شێوەیەک نا کە وا دەربکەوێت کە مۆڵەتدەر پشتگیری تۆ یان بەکارهێنانەکەت بکات.
دەتوانی مۆڵەتنامەی دڵخوازت ھەڵبژێریت.
مێژووی پەڕگە
کرتە بکە لەسەر یەکێک لە ڕێکەوت/کاتەکان بۆ بینینی پەڕگەکە بەو شێوەی لەو کاتەدا بووە.
| ڕێکەوت/کات | ھێما | ئەندازە | بەکارھێنەر | تێبینی | |
|---|---|---|---|---|---|
| هەنووکە | ١٢:٤٦، ٢٥ی تەممووزی ٢٠١٣ | | ٦٠٠ لە ٦٠٠ (١٨ کیلۆبایت) | wikimediacommons>IkamusumeFan | 1. Source code added; 2. Refine axis labels; 3. Grid added. |
بەکارھێنانی پەڕگە
ئەم پەڕەیە ئەم پەڕگەیە بەکار دەھێنێت: